HDB Resale Analysis
1 Datasets used
HDB resale transactions were extracted from https://data.gov.sg/dataset/resale-flat-prices.
The geocode of HDB flats were extracted using Google Map API.
The geocode of MRT stations in Singapore was extracted from https://github.com/hxchua/datadoubleconfirm/blob/master/datasets/mrtsg.csv.
The shopping mall data was extracted from https://github.com/ValaryLim/Mall-Coordinates-Web-Scraper/blob/master/mall_coordinates_updated.csv.
The school data was extracted from https://data.gov.sg/dataset/school-directory-and-information.
COE premium was extracted from https://data.gov.sg/dataset/coe-bidding-results.
The following libraries are required for this analysis.
library(tidyverse)
library(readr)
library(dplyr)
library(stringr)
library(ggmap)
library(geosphere)
library(plotly)
library(knitr)
library(kableExtra)
library(caret)
library(yardstick)
library(tidyr)

#pls change the working directory accordingly
setwd("~/Documents/nBox/R/hdb/")

options(scipen = 999)
2 Importing & wrangling
2.1 HDB data
#Import all files downloaded from HDB. The files' name start with "resale...")
filenames <- list.files(pattern="^resale")

data <- tibble()

for(i in 1:length(filenames)){
  df <- read_csv(filenames[i])
  if ("remaining_lease" %in% colnames(df)) {
    df <- df %>%
      separate(col = month, into = c("year", "month"), sep = "\\-") %>%
      mutate(year=as.integer(year), month=as.integer(month)) %>%
      mutate(remaining_lease=as.integer(str_extract(remaining_lease, "\\d{2}"))) #to standardize year only
  }
  else {
    df <- df %>%
      separate(col = month, into = c("year", "month"), sep = "\\-") %>%
      mutate(year=as.integer(year), month=as.integer(month)) %>%
      mutate(remaining_lease = 99 -(year-as.integer(lease_commence_date)))
  }

  data <- bind_rows(data, df)

}

#create column for address to get geocode
data <- data %>%
  mutate(address=paste(block,street_name, "Singapore", sep = " "))

unique_add <- data %>%
  distinct(address) %>%
  ggmap::mutate_geocode(address)

# check for addresses not geocoded
incomplete_addresses <- unique_add %>%
  filter(is.na(lat) | is.na(lon)) %>%
  select(-c(lat, lon)) %>%
  mutate(address2 = str_replace(address, "C'WEALTH", "COMMONWEALTH")) %>%
  mutate_geocode(address2) %>%
  select(-address2)

# checks for any errors in geocodinng
incorrect_addresses <- unique_add %>%
  filter(lat < 0 | lat > 2 | lon < 102 | lon > 108) %>%
  select(-c(lat, lon)) %>%
  left_join(data, by="address") %>%
  distinct(address, .keep_all = TRUE) %>%
  select(c(town,address)) %>%
  mutate(address2 = paste("\\'",address, town,"\\'")) %>%
  mutate_geocode(address2) %>%
  select(-c(address2,town))

# merge all address with geocodes
unique_add <- unique_add %>%
  filter(!(lat < 0 | lat > 2 | lon < 102 | lon > 108)) %>%
  filter(!is.na(lat) & !is.na(lon)) %>%
  bind_rows(incomplete_addresses) %>%
  bind_rows(incorrect_addresses)


#combine original data with geocodes

data2 <- left_join(data,unique_add, by ="address")

saveRDS(data2, "data.RDS")
2.2 MRT
#rearrange the long and lat column

mrt <- read.csv("mrt.csv") %>%
  distinct(STN_NAME, .keep_all =TRUE) %>%
  select(c(2,7,6,8)) %>%
  rename(lon=Longitude, lat=Latitude, mrt=STN_NAME)

#calculating the nearest MRT using distGeo function. Distance is in KM.

#preallocate the memory to store the result
near_mrt<-vector(length=nrow(unique_add))
mrt_dist<-vector(length=nrow(unique_add))

for (i in 1:nrow(unique_add)) {
  distance=distGeo(unique_add[i,2:3], mrt[,2:3])
  near_mrt[i]<-which.min(distance)
  mrt_dist[i]<-min(distance)/1000
}

unique_add$near_mrt<-mrt$mrt[near_mrt]

unique_add$mrt_dist = mrt_dist
2.3 Shopping mall
mall <- read.csv("mall.csv") %>%
  select(3,1,2)

near_mall<-vector(length=nrow(unique_add))
mall_dist<-vector(length=nrow(unique_add))
for (i in 1:nrow(unique_add)) {
  distance=distGeo(unique_add[i,2:3], mall[,2:3])
  near_mall[i]<-which.min(distance)
  mall_dist[i]<-min(distance)/1000
}

unique_add$near_mall<-mall$mall[near_mall]
unique_add$mall_dist = mall_dist
2.4 School
schools <- read.csv("schools.csv") %>%
  select(1,3,4) %>%
  mutate(address2=paste(address, postal_code,sep=" ")) %>%
  mutate_geocode(address2) %>%
  select(-c(address2,address,postal_code))

near_school<-vector(length=nrow(unique_add))
school_dist<-vector(length=nrow(unique_add))
for (i in 1:nrow(unique_add)) {
  distance=distGeo(unique_add[i,2:3], schools[,2:3])
  near_school[i]<-which.min(distance)
  school_dist[i]<-min(distance)/1000
}

unique_add$near_school<-schools$school_name[near_school]
unique_add$school_dist = school_dist


unique_add2 <- unique_add %>%
  select(-c(lon,lat))

saveRDS(unique_add2, "unique.RDS")
2.5 Combining and wrangling all datasets
Following are excluded from the final dataset:
- Outliers based on resale price
- Entries without flat type information
- Entries with town = Lim Chu Kang
unique_add2 <- readRDS("unique.RDS")
data2 <- readRDS("data.RDS")

data3 <- data2 %>%
  inner_join(unique_add2, by = "address")

#rename the flat type and exclude those with NA as flat types

data3 <- data3 %>%
  filter(!is.na(flat_type)) %>%
  mutate(flat_type= case_when(flat_type == "1 ROOM" ~ "1R",
                             flat_type == "2 ROOM" ~ "2R",
                             flat_type == "3 ROOM" ~ "3R",
                             flat_type == "4 ROOM" ~ "4R",
                             flat_type == "5 ROOM" ~ "5R",
                             flat_type == "EXECUTIVE" ~ "6R",
                             flat_type == "MULTI-GENERATION" ~ "7R",
                             flat_type == "MULTI GENERATION" ~ "7R"),
         flat_type= as.factor(flat_type),
         age=year-lease_commence_date,
         town=as.factor(town))

#to remove outliers

remove_outliers <- function(x, na.rm = T, ...) {
  qnt <- quantile(x, probs=c(.25, .75), na.rm = na.rm, ...)
  H <- 1.5 * IQR(x, na.rm = na.rm)
  y <- x
  y[x < (qnt[1] - H)] <- NA
  y[x > (qnt[2] + H)] <- NA
  y
}

data3$resale_clean <- remove_outliers(data3$resale_price)

data4 <- data3 %>%
  drop_na(resale_clean)

#looking at the summary of the data, some of the entries has remaining lease of more than 99 years. This is because the lease commencent year is later than the transaction date. Since these are resale HDB, we are not sure why this is possible. Therefore, we remove such entries. Also, we exclude Lim Chu Kan data as it has data only until 1998.

summary(data4)

data5 <- data4 %>%
  filter(remaining_lease <= 99) %>%
  filter(town != "LIM CHU KANG")

saveRDS(data5, "data_clean.RDS")
write.csv(data5, file = "mydata.csv")
2.6 Sample data
Quick peek on the dataset:
load("~/Documents/nBox/R/hdb/datav3.RData")
data5 <- read.csv("~/Documents/nBox/R/hdb/mydata.csv")

five <- tail(data5,n=10)

kable(five) %>%
  kable_styling(bootstrap_options = c("striped", "hover")) %>%
scroll_box(width = "100%", height = "400px")| year | month | town | flat_type | block | street_name | storey_range | floor_area_sqm | flat_model | lease_commence_date | resale_price | remaining_lease | address | lon | lat | mrt | mrt_dist | near_mall | mall_dist | near_school | school_dist | age | resale_clean | |
|---|---|---|---|---|---|---|---|---|---|---|---|---|---|---|---|---|---|---|---|---|---|---|---|
| 793934 | 2019 | 10 | YISHUN | 5R | 850 | YISHUN ST 81 | 04 TO 06 | 128 | Improved | 1988 | 540000 | 67 | 850 YISHUN ST 81 Singapore | 103.8360 | 1.416346 | KHATIB MRT STATION | 0.3509089 | WISTERIA MALL | 0.6149974 | ORCHID PARK SECONDARY SCHOOL | 0.2932485 | 31 | 540000 |
| 793935 | 2019 | 10 | YISHUN | 5R | 874 | YISHUN ST 81 | 01 TO 03 | 122 | Improved | 1988 | 415000 | 67 | 874 YISHUN ST 81 Singapore | 103.8363 | 1.415277 | KHATIB MRT STATION | 0.4408910 | WISTERIA MALL | 0.6221038 | ORCHID PARK SECONDARY SCHOOL | 0.2268274 | 31 | 415000 |
| 793936 | 2019 | 10 | YISHUN | 5R | 820 | YISHUN ST 81 | 10 TO 12 | 122 | Improved | 1988 | 520000 | 67 | 820 YISHUN ST 81 Singapore | 103.8337 | 1.413093 | KHATIB MRT STATION | 0.4814526 | WISTERIA MALL | 0.9972455 | ORCHID PARK SECONDARY SCHOOL | 0.5737060 | 31 | 520000 |
| 793937 | 2019 | 10 | YISHUN | 6R | 344 | YISHUN AVE 11 | 01 TO 03 | 146 | Maisonette | 1988 | 505000 | 67 | 344 YISHUN AVE 11 Singapore | 103.8444 | 1.429038 | YISHUN MRT STATION | 1.0446595 | JUNCTION NINE | 0.5393704 | HUAMIN PRIMARY SCHOOL | 0.1334673 | 31 | 505000 |
| 793938 | 2019 | 10 | YISHUN | 6R | 791 | YISHUN AVE 2 | 04 TO 06 | 146 | Maisonette | 1987 | 550000 | 66 | 791 YISHUN AVE 2 Singapore | 103.8336 | 1.420502 | KHATIB MRT STATION | 0.3522745 | NORTHPOINT CITY | 0.8750608 | NAVAL BASE SECONDARY SCHOOL | 0.3207240 | 32 | 550000 |
| 793939 | 2019 | 10 | YISHUN | 6R | 406 | YISHUN AVE 6 | 01 TO 03 | 148 | Maisonette | 1988 | 566000 | 68 | 406 YISHUN AVE 6 Singapore | 103.8493 | 1.425908 | YISHUN MRT STATION | 1.6379015 | JUNCTION NINE | 1.1636621 | NORTH VIEW PRIMARY SCHOOL | 0.2169060 | 31 | 566000 |
| 793940 | 2019 | 10 | YISHUN | 6R | 324 | YISHUN CTRL | 04 TO 06 | 142 | Apartment | 1988 | 510000 | 67 | 324 YISHUN CTRL Singapore | 103.8419 | 1.428448 | YISHUN MRT STATION | 0.7718536 | JUNCTION NINE | 0.5077439 | HUAMIN PRIMARY SCHOOL | 0.3236775 | 31 | 510000 |
| 793941 | 2019 | 10 | YISHUN | 6R | 326 | YISHUN RING RD | 01 TO 03 | 146 | Maisonette | 1988 | 530000 | 67 | 326 YISHUN RING RD Singapore | 103.8424 | 1.429692 | YISHUN MRT STATION | 0.8249148 | JUNCTION NINE | 0.3802179 | HUAMIN PRIMARY SCHOOL | 0.3258902 | 31 | 530000 |
| 793942 | 2019 | 10 | YISHUN | 6R | 606 | YISHUN ST 61 | 10 TO 12 | 146 | Maisonette | 1987 | 638000 | 67 | 606 YISHUN ST 61 Singapore | 103.8362 | 1.421362 | KHATIB MRT STATION | 0.5649737 | WISTERIA MALL | 0.6758045 | CHUNG CHENG HIGH SCHOOL (YISHUN) | 0.3169986 | 32 | 638000 |
| 793943 | 2019 | 10 | YISHUN | 6R | 824 | YISHUN ST 81 | 04 TO 06 | 146 | Maisonette | 1987 | 628000 | 67 | 824 YISHUN ST 81 Singapore | 103.8333 | 1.413682 | KHATIB MRT STATION | 0.4104465 | WISTERIA MALL | 1.0074276 | PEIYING PRIMARY SCHOOL | 0.5324027 | 32 | 628000 |
3 Data Visualization
Overall, the number of HDB resale transactions surged during the Asian financial crisis (1998-1999) and US financial crisis (2008-2009).
3.1 Overview at national level
#Data Visualization

overview_nat <- data5 %>%
  group_by(year) %>%
  summarise(no_trans=n(), median_price=median(resale_clean, na.rm=T))

overview_town <- data5 %>%
  group_by(year,town) %>%
  summarise(no_trans=n(), median_price=median(resale_clean, na.rm=T))

#visualise natl overview
overview_nat %>%
  ggplot(aes(x=year, y=no_trans)) +
  geom_line(size=2,col="deepskyblue")+
  geom_segment(aes(xend = year, yend = no_trans)) +
  geom_point(size = 3, col="deepskyblue") +
  labs(title = "No of HDB resale transactions over the years",
       x = "No of transactions",
       y="Year") +
  scale_x_continuous(breaks=seq(1990,2020,by=5))+
  theme(panel.grid.major = element_blank(), panel.grid.minor = element_blank(),
        panel.background = element_blank(), axis.line = element_line(colour = "black"))+
  gganimate::transition_reveal(year)
## NULLThe HDB resale price increases almost 4 times (without taking into account inflation) since 1990. It peaked in 2013, and due to several cooling measures implemented by the government, it then decreased and subsequently stabilized.
g <- overview_nat %>%
  ggplot(aes(x=year, y=median_price)) +
  geom_line(size=2,col="deepskyblue")+
  geom_point(size = 2,col="deepskyblue") +
  labs(title = "Median HDB resale price over the years",
       x = "Year",
       y = "Median price") +
  scale_x_continuous(breaks=seq(1990,2020,by=5))+
  theme(panel.grid.major = element_blank(), panel.grid.minor = element_blank(),
        panel.background = element_blank(), axis.line = element_line(colour = "black"))

ggplotly(g)
3.2 Overview based on HDB town
You can double click on the town name to filter on a particular town.
# breakdown by town

h <- overview_town %>%
  ggplot(aes(x=year, y=median_price,col=town)) +
  geom_line() +
  labs(title="Median HDB resale price over the years",
       x = "Year",
       y = "Median price") +
  theme(panel.grid.major = element_blank(), panel.grid.minor = element_blank(),
        panel.background = element_blank(), axis.line = element_line(colour = "black"))

ggplotly(h) #can double click to isolate a town
i <- overview_town %>%
ggplot(aes(x=year, y=no_trans,col=town)) +
geom_line() +
labs(title="No of resale transactions over the years",
x = "Year",
y = "No of transactions") +
theme(panel.grid.major = element_blank(), panel.grid.minor = element_blank(),
panel.background = element_blank(), axis.line = element_line(colour = "black"))
ggplotly(i) #can double click to isolate a town3.3 Overview dashboard
The dashboard can also be accessed from https://public.tableau.com/profile/irine#!/vizhome/hdbv2/Overview.
3.4 Recommender dashboard
The following dashboard aims to help potential buyers to identify their “dream flat” given their budget, flat types, town and the proximity of the flat to important locations, such as the nearest MRT station, school and shopping mall. The dashboard can also be accessed from https://public.tableau.com/profile/irine#!/vizhome/hdbv2/Recommender.
4 Data Modelling
4.1 Model HDB resale price in 2014
For this data modelling, we will use data from 2014 for our training and testing.
Before performing modelling, let’s check the following:
The HDB resale price are normally distributed with slightly longer right tail
There is a relationship between HDB resale price with age, town and flat type
town <- data_2014 %>%
  ggplot(aes(x=fct_reorder(town, resale_clean), y= resale_clean, fill = town)) +
  geom_boxplot(aes(lower= 348000,middle = 410000,upper=480000,
                   ymin=195000   ,ymax=678000),
               varwidth=TRUE,
               notch = TRUE) +
  labs(title="Median HDB resale price by town",
       y="Resale Price",
       x="Town") +
  theme(axis.text.x = element_text(angle = 90, hjust = 1))

ggplotly(town)
flat <- data_2014 %>%
ggplot(aes(x=fct_reorder(flat_type, resale_clean), y= resale_clean, fill = flat_type)) +
geom_boxplot(aes(lower= 348000,middle = 410000,upper=480000,
ymin=195000 ,ymax=678000),
varwidth=TRUE,
notch = TRUE) +
labs(title="Median HDB resale price by flat type",
y="Resale Price",
x="Flat Type") +
theme(axis.text.x = element_text(angle = 90, hjust = 1))
ggplotly(flat)library(broom)
corr <- data_2014 %>%
select(age, mrt_dist , mall_dist , school_dist, resale_clean) %>%
as.matrix(.) %>%
Hmisc::rcorr(.) %>%
tidy(.) %>% as_tibble() %>%
filter(p.value < 0.05)
corr <- corr %>% rename(var1 =column1, var2 = column2)
kable(corr) %>% kable_styling(bootstrap_options = c("striped", "hover"))| var1 | var2 | estimate | n | p.value |
|---|---|---|---|---|
| age | mrt_dist | 0.1871008 | 15153 | 0.0000000 |
| age | mall_dist | 0.3076847 | 15153 | 0.0000000 |
| mrt_dist | mall_dist | 0.2218621 | 15153 | 0.0000000 |
| age | school_dist | 0.2184335 | 15153 | 0.0000000 |
| mrt_dist | school_dist | 0.0583201 | 15153 | 0.0000000 |
| mall_dist | school_dist | 0.1271302 | 15153 | 0.0000000 |
| age | resale_clean | -0.4567996 | 15153 | 0.0000000 |
| mrt_dist | resale_clean | -0.1048230 | 15153 | 0.0000000 |
| mall_dist | resale_clean | -0.1923928 | 15153 | 0.0000000 |
| school_dist | resale_clean | -0.0229855 | 15153 | 0.0046607 |
Next, we split the dataset between training set (80% of the data) and testing set (20% of the data).
library(rsample)
set.seed(20191214)

inTrain <- data_2014 %>%
  initial_split(prop = 0.8)

training <- training(inTrain)
testing <- testing(inTrain)
4.1.1 Linear Regression
Since the resale price seems to be normally distributed, let’s start modelling with linear regression. Comparing the two models below, the model which contains more variables (i.e. model 2) has a better accuracy (i.e. higher Adjusted R Square) and lower (i.e. lower MAE). It can also be confirmed using Anova test.
# using 3 stipulated variables
model1 <- lm(resale_clean ~ age + flat_type+town , training)

summary(model1)

#include other variables that are also relevant to price

model2 <- lm(resale_clean ~ age + flat_type + town + mrt_dist + mall_dist+ school_dist, training)

summary(model2)

#evaluate

results_lm <- testing %>%
  mutate(model1 = predict(model1, testing),
         model2 = predict(model2, testing))


lm_1 <- metrics(results_lm, truth = resale_clean, estimate = model1) %>%
  mutate(ml_method = "Linear Regression 1")

lm_2 <- metrics(results_lm, truth = resale_clean, estimate = model2) %>%
  mutate(ml_method = "Linear Regression 2")

results_regression <- bind_rows(lm_1,lm_2) %>%
  dplyr::select(-.estimator)

kable(results_regression) %>% kable_styling(bootstrap_options = c("striped", "hover"))

# and test whether model 2 is indeed better than model 1
anova(model1,model2)
4.1.2 Additional machine learning algorithms
Two additional machine learning algorithms will be explored to further improve the accuracy and error in predicting HDB resale price. Bootstrapping will also be implemented.
Gradient Boosting Machines (Boosting)
Random forest
train_boosting <- train(resale_clean ~ age + flat_type + town + mrt_dist + mall_dist+ school_dist ,
                             method = "gbm",
                             data = training,
                             trControl = trainControl(method = "boot"))

train_rf <- train(resale_clean ~ age + flat_type + town + mrt_dist + mall_dist+ school_dist,
                       method = "rf",
                       data = training,
                       trControl = trainControl(method = "boot"))
Next, let’s test and evaluate their performance.
results <- testing %>%
  mutate(boosting = predict(train_boosting, testing),
         random_forest = predict(train_rf, testing))

boosting <- metrics(results, truth = resale_clean, estimate = boosting) %>%
  mutate(ml_method = "Boosting")

rf <- metrics(results, truth = resale_clean, estimate = random_forest) %>%
  mutate(ml_method = "Random Forest")

results_wide <- bind_rows(boosting, rf)

results_present <- results_wide %>%
  dplyr::select(-.estimator)

kable(results_present) %>% kable_styling(bootstrap_options = c("striped", "hover"))| .metric | .estimate | ml_method |
|---|---|---|
| rmse | 62873.3071235 | Boosting |
| rsq | 0.6114637 | Boosting |
| mae | 45878.5657760 | Boosting |
| rmse | 44884.5442618 | Random Forest |
| rsq | 0.8067504 | Random Forest |
| mae | 33762.9863738 | Random Forest |
Lastly, let’s visualize the results.
#plot rmse
rmse <- results_wide %>% filter(.metric == "rmse") %>%
  ggplot(aes(x=reorder(ml_method, desc(.estimate)), y=.estimate, color=ml_method)) +
  geom_point(size=5) +
  scale_color_manual(labels=c("Random Forest",
                              "Boosting"),
                     values=c("Random Forest" = "deepskyblue3",
                              "Boosting" = "deepskyblue1"
                              ))+
  geom_hline(yintercept = 0, linetype="dotted", size = 1.5, color = "red") +
  coord_flip() +
  labs(title = "",
       subtitle = "",
       x = "",
       y = "Error in Test Set (RMSE)")+
  theme_linedraw() +
  theme(legend.position = "none")

  #plot mae
mae <- results_wide %>% filter(.metric == "mae") %>%
  ggplot(aes(x=reorder(ml_method, desc(.estimate)), y=.estimate, color=ml_method)) +
  geom_point(size=5) +
  scale_color_manual(labels=c("Random Forest",
                              "Boosting"),
                     values=c("Random Forest" = "deepskyblue3",
                              "Boosting" = "deepskyblue1"))+
  geom_hline(yintercept = 0, linetype="dotted", size = 1.5, color = "red") +
  coord_flip() +
  labs(title = "",
       subtitle = "",
       x = "",
       y = "Error in Test Set (MAE)")+
  theme_linedraw() +
  theme(legend.position = "none")

gridExtra::grid.arrange(mae,rmse, ncol = 2, nrow=1,
                        top = "Random forest has the smallest error (RMSE & MAE)")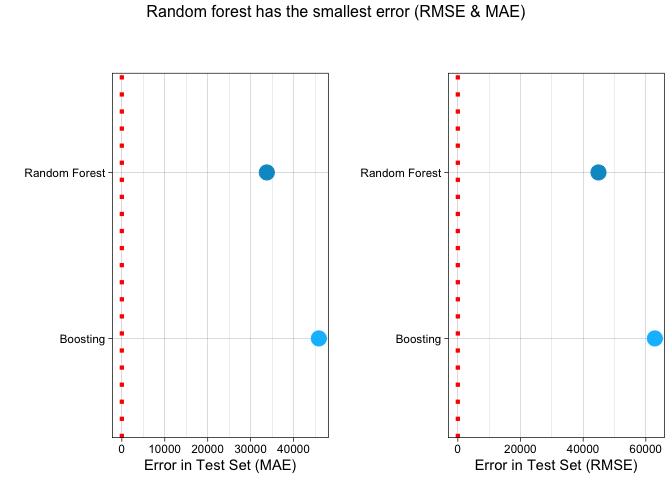
#plot actual vs prediction
results %>%
  gather(ml_method, result, c(boosting,random_forest)) %>%
  mutate(ml_method = factor(ml_method,
                            levels=c("boosting",
                                     "random_forest"),
                            labels=c("Boosting",
                                     "Random Forest"))) %>%
  ggplot(aes(x=resale_clean, y=result, color = ml_method)) +
  geom_point(size = 1, alpha = 0.3) +
  scale_color_manual(values = c("deepskyblue1",
                                "deepskyblue3")) +
  facet_grid(.~ml_method) +
  geom_abline(linetype = "dotted", color = "red", size = 1) +
  geom_smooth(method = "lm") +
  labs(title = "Comparisons of algorithms regarding accuracy of predicting HDB resale price",
       subtitle = "Random Forest led to the most accurate prediction.",
       x = "Observed Price",
       y = "Predicted Price")+
  scale_x_continuous(breaks = c(200000, 400000, 600000))+
  scale_y_continuous(breaks = c(200000, 400000, 600000))+
  theme(axis.text.x = element_text(angle=90, hjust=1))+
  theme_linedraw() +
  theme(legend.position="none")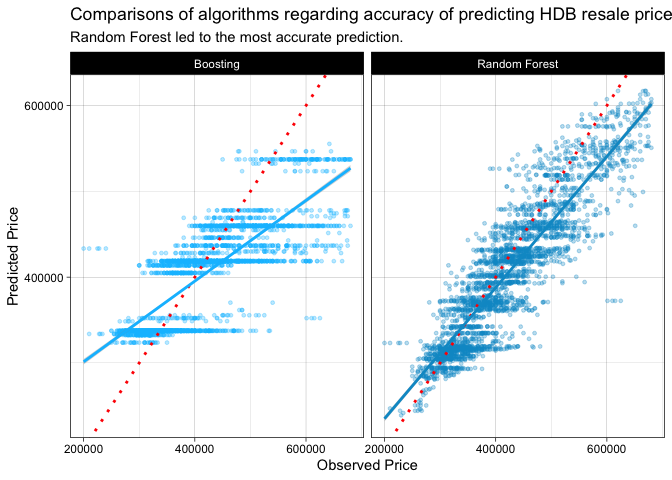
Random Forest led to the most accurate prediction. It has the highest accuracy (R Square) and lowest error (MAE and RMSE).
4.2 Is this flat overpriced?
A flat was sold in Nov 2017 with the following characteristics:
- Flat type: 4 ROOM
- Town: Yishun
- Flat Model: New Generation
- Storey Range: 10 to 12
- Floor Area (sqm): 91
- Lease Commence Date: 1984
- Resale Price: 550,800
YES, it is overpriced based on resale transactions in 2017 for 4RM flats within the age of 30 - 35 years, located at 10 to 12 storey, with floor area of 90 - 100 sqm. The price paid $ 550,800 is above the maximum price paid for Yishun.
sample <- data5 %>%
  filter((age >= 30 & age <= 35) & year == 2017 & flat_type == "4R" & storey_range == "10 TO 12" & (floor_area_sqm >= 90 & floor_area_sqm <= 100))

#boxplot.stats(sample$resale_clean)

#295000 360000 384000 410000 482000

exp <- sample %>%
  ggplot(aes(x=fct_reorder(town, resale_clean), y= resale_clean, fill = town)) +
  geom_boxplot(aes(lower= 360000,middle = 384000,upper=410000,
                   ymin=295000   ,ymax=482000),
               varwidth=TRUE,
               notch = TRUE) +
  geom_hline(yintercept=550800, color='coral')+
  labs(title="Yes, $550,800 is way too expensive for a Yishun flat",
       y="Resale Price",
       x="Town") +
  theme(axis.text.x = element_text(angle = 90, hjust = 1))

ggplotly(exp)
4.3 Predict flat types using other characteristics
Decision tree is adopted to predict flat types based on other characteristics of the flats, such as: floor area sqm, flat model, town and age. Based on the tree below, only floor area sqm and flat model are important. The following model accuracy in predicting flat type is above 96%.
library(rpart)
library(rattle)
library(rpart.plot)
library(RColorBrewer)

fit <- rpart(flat_type ~ floor_area_sqm + flat_model + town + age ,
             method="class", data=training)

fancyRpartPlot(fit, sub="")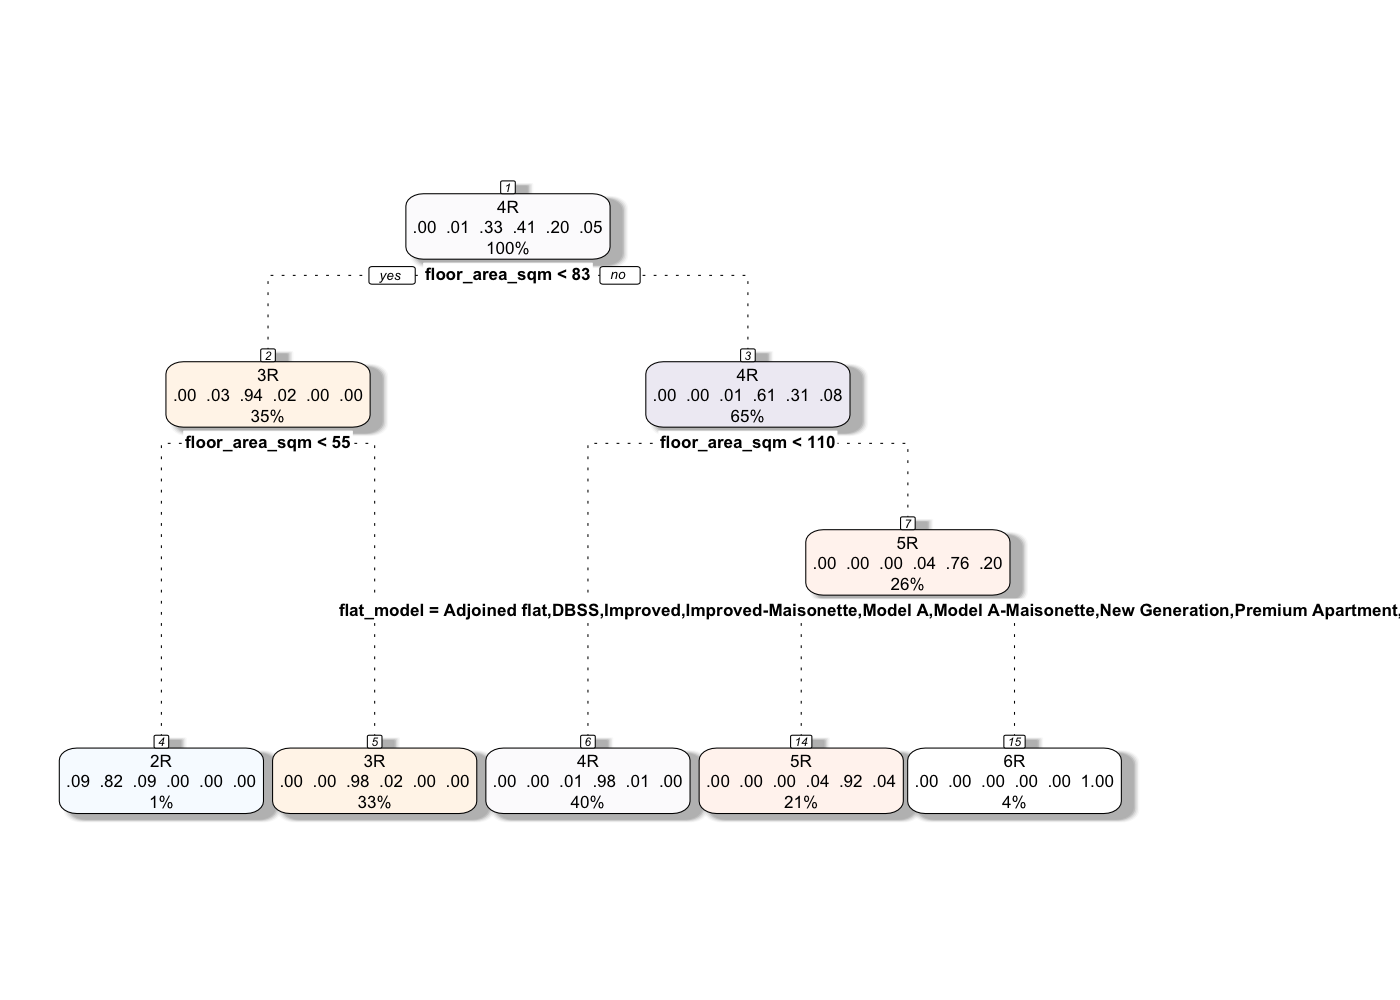
prediction <- predict(fit,testing, type = "class")

confMat <- table(testing$flat_type,prediction)

accuracy <- sum(diag(confMat))/sum(confMat)

accuracy
## [1] 0.96534655 Policy Analysis
5.1 Are Yishun flats the cheapest?
Yishun has received a negative reputation as a place to stay due to various incidents involving - cat killings, murders, etc. from the past 5 years. Therefore, the following analysis is limited to 2014 to 2018 period.
Based on the median resale price, Yishun flats are the cheapest in Singapore together with Toa Payoh flats. However looking at the price per sqm, Yishun flats are not the cheapest.
data5years <- data5 %>%
  filter(year >= 2014 & year <= 2018)

#boxplot.stats(data5years$resale_clean)

# 160000 333888 400000 472000 678888

yishun <- data5years %>%
  ggplot(aes(x=fct_reorder(town, resale_clean), y= resale_clean, fill = town)) +
  geom_boxplot(aes(lower= 333888,middle = 400000,upper=472000,
                   ymin=160000 ,ymax=678888),
               varwidth=TRUE,
               notch = TRUE) +
  labs(title="Median HDB resale price for 2014 - 2018",
       y="Resale Price",
       x="Town") +
  theme(axis.text.x = element_text(angle = 90, hjust = 1))

ggplotly(yishun)
#how about based on price per sqm?
data5years <- data5years %>%
mutate(psqm=resale_clean/floor_area_sqm)
#boxplot.stats(data5years$psqm)
# 2439.024 3818.182 4257.426 4777.778 6216.21
yishunb <- data5years %>%
ggplot(aes(x=fct_reorder(town, psqm), y= psqm, fill = town)) +
geom_boxplot(aes(lower= 3818.182,middle = 4257.426,upper=4777.778,
ymin=2439.024 ,ymax=6216.21),
varwidth=TRUE,
notch = TRUE) +
labs(title="Looking at the price per sqm, Yishun is NOT the lowest",
y="Price per sqm",
x="Town") +
theme(axis.text.x = element_text(angle = 90, hjust = 1))
ggplotly(yishunb)5.2 Flat sizes have gotten smaller over the years?
Based on the chart below, majority of the flat size in Singapore have remained the same over the years, except for 7R (i.e. Multi-Generation flats).
overview_size <- data5 %>%
  group_by(year,flat_type) %>%
  summarise(median_size=median(floor_area_sqm))

size <- overview_size %>%
  ggplot(aes(x=year, y=median_size, col=flat_type)) +
  geom_line(size=2)+
  geom_point(size = 2) +
  labs(title = "HDB flat size over the years",
       subtitle = "",
       x= "Year",
       y="Median Floor Area (sqm)") +
  scale_x_continuous(breaks=seq(1990,2020,by=5))+
  theme(panel.grid.major = element_blank(), panel.grid.minor = element_blank(),
        panel.background = element_blank(), axis.line = element_line(colour = "black"))

ggplotly(size)
5.3 Did the opening of DTL increase the price of HDB flats serviced by this line?
The construction of DTL started in 2009. The 1st stage of DTL started operation in 2013, followed by 2nd stage in 2015 and the last stage in 2017. In this model, the construction is adopted as the time when treatment started.
To use this model, two dummy variables must be created:
- A dummy variable called “nearby” to identify the control vs treatment group
Treatment group (value = 1): flats that would benefit from the opening of DTL (i.e. flats located within 1KM distance of DTL MRT stations)
Control group (value = 0: flats that would not be affected bythe opening of DTL (i.e. flats located more than 1KM distance of DTL MRT stations)
- A dummy variable called after_dt to indicate the time when the construction started
Value = 1: flats transcated 2010 onwards
Value = 0: flats transcated prior to 2010
Lastly, another variable called did is created for the interaction between time and treatment effect.
#list of DT MRT

dt_mrt <- read.csv("~/Documents/nBox/R/hdb/mrt2.csv") %>%
  filter(COLOR == "BLUE") %>%
  select(STN_NAME, COLOR) %>%
  rename(mrt=STN_NAME)

data_dt <- data5 %>%
  left_join(dt_mrt, by ="mrt")%>%
  drop_na(COLOR)

data_dt <- data_dt %>%
  mutate(after_dt = ifelse(year > 2009,1,0),
         nearby = ifelse(mrt_dist <= 1, 1 ,0),
         did = after_dt * nearby,
         psqm=resale_clean/floor_area_sqm)

sum_data_dt <- data_dt %>%
  group_by(year,nearby) %>%
  summarise(median=median(resale_clean))
The following model estimates the did estimator:
#  using regression

didreg <- lm(resale_clean ~ after_dt + nearby + did, data = data_dt)
summary(didreg)
##
## Call:
## lm(formula = resale_clean ~ after_dt + nearby + did, data = data_dt)
##
## Residuals:
## Min 1Q Median 3Q Max
## -279621 -80621 -13636 68864 441364
##
## Coefficients:
## Estimate Std. Error t value Pr(>|t|)
## (Intercept) 329621 1240 265.802 <0.0000000000000002 ***
## after_dt 139839 2558 54.678 <0.0000000000000002 ***
## nearby -90986 1296 -70.194 <0.0000000000000002 ***
## did 25464 2691 9.462 <0.0000000000000002 ***
## ---
## Signif. codes: 0 '***' 0.001 '**' 0.01 '*' 0.05 '.' 0.1 ' ' 1
##
## Residual standard error: 111600 on 120351 degrees of freedom
## Multiple R-squared: 0.2863, Adjusted R-squared: 0.2863
## F-statistic: 1.609e+04 on 3 and 120351 DF, p-value: < 0.00000000000000022sum_data_dt %>%
ggplot(aes(x=year, y=median, group=nearby)) +
geom_line(aes(col=as.factor(nearby)),size = 2)+
geom_vline(xintercept = 2010, size =1, col="#00ba38")+
geom_vline(xintercept = 2013, size =1,col="#00ba38")+
geom_vline(xintercept = 2015, size =1, col="#00ba38")+
geom_vline(xintercept = 2017, size =1,col="#00ba38")+
labs(title="Time Series of HDB resale price along DTL MRTs",
subtitle ="The price seems to increase with time regardless of the proximity to the DTL",
y="Median resale price",
x="Year") + # title and caption
scale_x_continuous(breaks = seq(1990, 2020, by = 5))+
scale_color_manual(name = "Distance to DTL",
labels = c("Within 1 KM", "More than 1 KM"),
values = c("1"="deepskyblue", "0"="#f8766d")) +
annotate("text", x = 2010, y = 200000, label = "Construction", size = 2, hjust = 0) +
annotate("text", x = 2013, y = 210000, label = "Stage 1", size = 2,hjust = 0) +
annotate("text", x = 2015, y = 220000, label = "Stage 2",size = 2, hjust = 0) +
annotate("text", x = 2017, y = 230000, label = "Stage 3",size = 2, hjust = 0) +
theme(panel.grid.major = element_blank(), panel.grid.minor = element_blank(),
panel.background = element_blank(), axis.line = element_line(colour = "black"))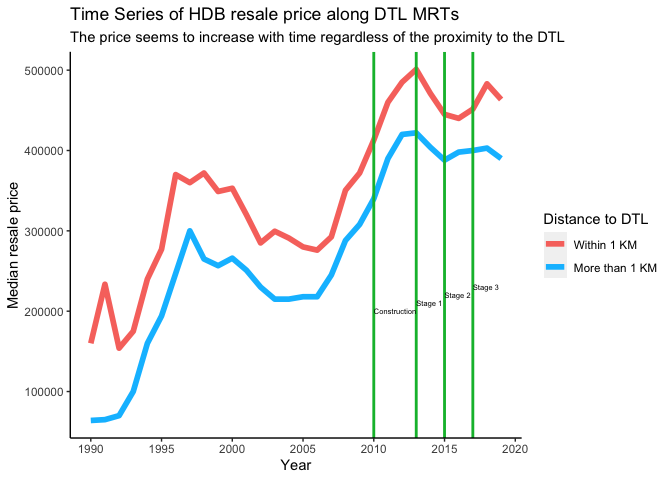
The coefficient for did is the differences-in-differences estimator. Both the did and after_dt coefficients are statistically significant and have positive effect. While the treatment variable nearby has a negative effect to the price increment, but also statistically significant.
Based on the time series chart above, the price of HDB flats serviced by the line showed a steady increase from 2010 onwards (i.e. construction stage of DTL) regardless of the proximity to the MRTs. Therefore, it can be concluded that the opening of DTL does influence the price of flats serviced by DTL.
5.4 Are resale prices in HDB estates in areas further away from the city (i.e. Sengkang and Punggol) impacted by Certificate of Entitlement (COE) prices for cars?
In this analysis, distance from the flat to Raffles City MRT station is used as a proxy to estimate the distance from the flat to CBD (or city).
#let's define distance to cbd as distance to raffles place mrt
#raffles place mrt

raffles <- mrt %>% filter(mrt == "RAFFLES PLACE MRT STATION")

cbd_dist<-vector(length=nrow(data5))

for (i in 1:nrow(data5)) {
  cbd_dist[i] =distGeo(data5[i,14:15], raffles[1,2:3])
}

data5$cbd_dist = cbd_dist/1000

summary(data5$cbd_dist)
Based on the statistics summary, let’s create five levels of distance to CBD in KM: 0 to 4, 4 to 8, 8 to 12, 12 to 16, and more than 16 KM.
data5 <- read.csv("~/Documents/nBox/R/hdb/mydata2.csv")

data6 <- data5 %>%
  mutate(cbd_dist_level= case_when(cbd_dist < 4 ~ "0 - 4",
                                   (cbd_dist >=4 & cbd_dist < 8) ~ "4 - 8",
                                   (cbd_dist >=8 & cbd_dist < 12) ~ "8 - 12",
                                   (cbd_dist >=12 & cbd_dist < 16) ~ "12 - 16",
                                    (cbd_dist >= 16)
                                       ~ "More than 16"),
         cbd_dist_level=as.factor(cbd_dist_level),
         cbd_dist_level2=ordered(cbd_dist_level, levels = c("0 - 4", "4 - 8", "8 - 12", "12 - 16" , "More than 16")))
Now, let’s compare the median COE premium VS median HDB resale price over the years.
#limit to data from 2010 only as COE data is onlya available 2010 onwards
data10years <- data6 %>%
  filter(year >= 2010) %>%
  group_by(year,cbd_dist_level2) %>%
  summarise(median=median(resale_clean),trans=n())

#coe

coe <- read.csv("~/Documents/nBox/R/hdb/coe.csv") %>%
  select(1,7) %>%
  separate(col = month, into = c("year","month"), sep = "\\-") %>%
  mutate(year=as.integer(year), month=as.integer(month))

sum_coe <- coe %>%
  group_by(year) %>%
  summarise(med_coe=round(median(premium),0))

p1 <- sum_coe %>%
  ggplot(aes(x=year, y=med_coe)) +
  geom_line(col="coral", size=2)+
  labs(title="Median COE premium over the years",
       y="",
       x="Year")+
  scale_x_continuous(breaks = seq(2010, 2020, by = 1))+
  theme(panel.grid.major = element_blank(), panel.grid.minor = element_blank(),
        panel.background = element_blank(), axis.line = element_line(colour = "black"))

p2 <- data10years %>%
   ggplot(aes(x=year, y=median, group=cbd_dist_level2)) +
   geom_line(aes(col=cbd_dist_level2), size=2)+
   labs(title="Median HDB resale over the years",
       y="",
       x="Year",col= "Distance to CBD")+
   scale_x_continuous(breaks = seq(2010, 2020, by = 1))+
   theme(panel.grid.major = element_blank(), panel.grid.minor = element_blank(),
        panel.background = element_blank(), axis.line = element_line(colour = "black"),legend.position="bottom")

gridExtra::grid.arrange(p1,p2, ncol = 1, nrow=2,
                        top = "")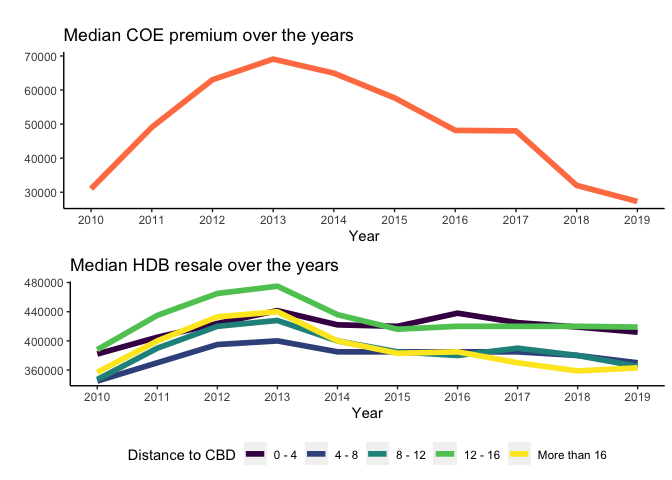
The original assumption is that when COE premium dropped, people would be buying flats further from the city so that the cost savings can be used for a car. As such, the price of flats further away from city would increase.
Looking at the price trends of HDB located within 12 - 16 KM from CBD (i.e. Punggol or Sengkang), when the COE premium dropped between 2013 to 2018, the resale price did not really increase. The resale price for flats within 12 - 16 KM actually dropped between 2013 to 2015 before stabilizing. However, the number of transactions for HDB located within 12 - 16 KM from CBD within this period (2013 to 2018) did increase.
The resale prices in HDB estates in areas further away from the city (i.e. Sengkang and Punggol) does not seem to be impacted by COE premium, but the number of transactions seems to be impacted.
d1 <- data10years %>%
  ggplot(aes(x=year, y=trans, group=cbd_dist_level2)) +
  geom_line(aes(col=cbd_dist_level2), size=2)+
  labs(title="No of HDB resale transactions over the years",
       y="",
       x="Year",col= "Distance to CBD")+
  scale_x_continuous(breaks = seq(2010, 2020, by = 1))+
  theme(panel.grid.major = element_blank(), panel.grid.minor = element_blank(),
        panel.background = element_blank(), axis.line = element_line(colour = "black"),legend.position="bottom")

ggplotly(d1)
#References